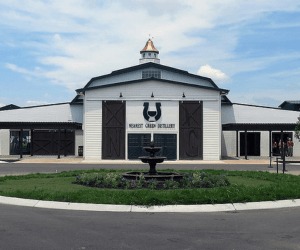
Moore tourism growth outpaces neighbors
7:42 p.m. Aug. 26, 2025

Courtesy SCTTA
DUANE CROSS
MCO Publisher•Editor
Moore County’s tourism sector posted one of the strongest growth rates in the region in 2024, according to new state data.
Figures from the Tennessee Department of Tourist Development’s County Snapshot reports show visitor spending in Moore County increased 10.61% over the previous year, reaching $15.59 million. The growth lifted the county’s statewide tourism ranking from 64th to 63rd.
By comparison, Bedford County grew 0.85% and Franklin County 8.48%, while Coffee County inched up just 0.23%. Lincoln County was the only one of the five to decline, down 1.67%.
Although Moore County’s overall visitor spending remains smaller than its neighbors, the pace of growth stands out. Coffee County led the five-county area with $146.12 million in visitor spending, ranking 19th in the state. Franklin County followed with $68.26 million, ranking 34th among all counties in the state. Bedford, Lincoln, and Moore all fell into a lower tier, with spending between $15 million and $30 million.
Tourism also played a significant role in supporting local employment and tax revenue. Moore County recorded 100 tourism-related jobs in 2024. The industry generated $1.12 million in state taxes and $244,500 in local taxes.
Statewide, one measure of tourism’s impact is the tax savings passed along to households. In Moore County, tourism reduced each household’s tax burden by an estimated $517 in 2024. That is higher than in Bedford ($154) and Lincoln ($195) but trails Coffee ($614) and Franklin ($393).
County-by-County Tourism Data


Moore County also stands out for the relative size of its tourism economy. Visitor activity accounts for 32.01% of the county’s retail and non-retail sales – far higher than in Bedford (2.74%), Coffee (5.75%), Franklin (10.20%), or Lincoln (5.07%).
The tourism snapshot reports are produced using a detailed modeling process designed to capture the full impact of visitor spending on local economies. The state begins by using survey data to estimate the number and type of visitors, as well as their spending across various industries, including lodging, restaurants, retail, recreation, and transportation. Those estimates are reinforced with industry-specific data, including hotel performance, aviation figures, and business sales records.
Government tax, employment, and income data are layered in to confirm spending patterns. The combined data is then applied to an economic input-output model within the IMPLAN platform, which uses U.S. Census and Bureau of Economic Analysis information to trace how visitor dollars flow through a county’s economy.
The model measures three levels of effect:
- Direct impacts from spending in visitor-facing sectors,
- Indirect impacts from supply-chain purchases made by those businesses, and
- Induced impacts from employee spending in the local economy.
Together, the analysis provides estimates of visitor-driven spending, employment, wages, and state and local tax revenue – offering a clearer picture of tourism’s contribution to Tennessee’s counties.
Moore County’s strong growth in 2024, combined with its heavy reliance on tourism compared to neighboring counties, underscores the industry’s central role in the Lynchburg economy.